As we enter a Biden administration and begin reflecting on the Trump years, it is useful to take stock of Michigan public opinion. A new analysis of State of the State Survey (SOSS) data compares how each Michigan county rates the performances of Gov. Gretchen Whitmer and former President Donald Trump.
IPPSR’s State of the State Survey enrolls YouGov, a data analytics firm headquartered in London, to survey Michigan’s views on public affairs—from consumer confidence to trust in government to presidential or gubernatorial approval ratings.
This round of the State of the State Survey interviewed 1,015 Michigan respondents online from October 20th to 28th, 2020.
Typically, we are only able to view statewide trends using this survey data, masking interesting geographic, demographic, or socio-economic variation. However, using state of the art methods, IPPSR is able to generate reliable county-specific estimates from the SOSS data.
To generate county-level estimates of public opinion from the larger SOSS data, we use an approach called multilevel regression and post-stratification (MrP). This method allows us to create reliable estimates of how counties respond to a question—even if there are only a few respondents to the survey from a given county—by using information about similar respondents in other counties. MrP is an approach widely used in the public opinion field, such as in YouGov’s 2020 presidential election forecast.
In the case of gubernatorial and presidential approval, respondents are asked if they approve or disapprove of the governor’s and president’s performance by rating it “excellent,” “good,” “not so good,” or “poor.” We consider “good” and “excellent” to indicate approval, and “not so good” and “poor” to mean disapproval.
The resulting county-level approval data follows patterns mostly in-line with national electoral and demographic trends.
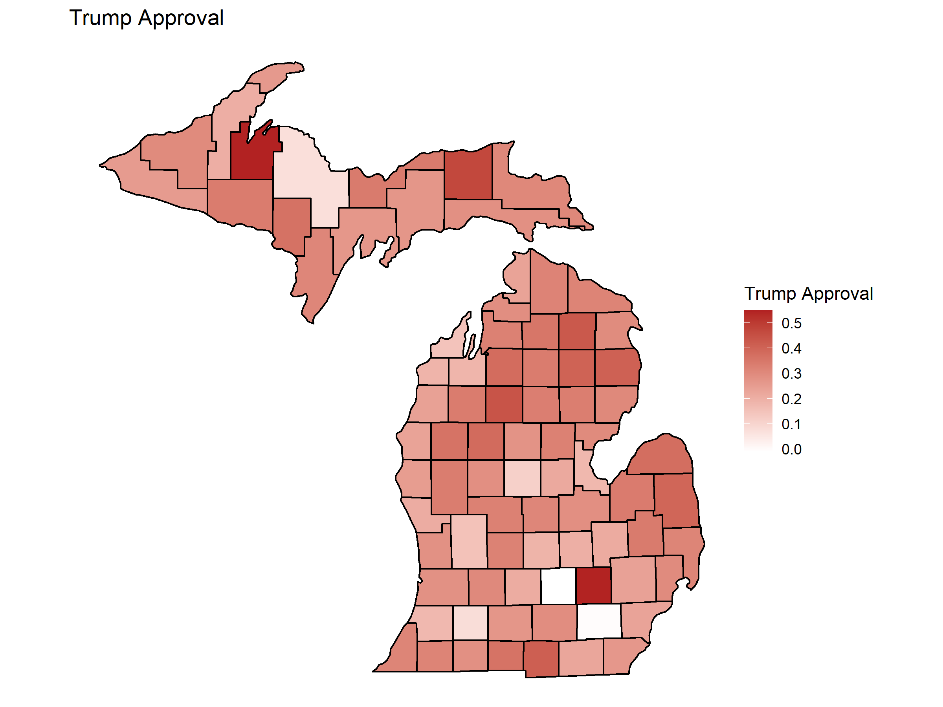
For example, the county-level analysis shows that Whitmer’s approval outpaces Trump’s in Michigan’s most educated counties (defined as the number of adults who have achieved higher levels of education), often by staggering margins. In Washtenaw, the county with the highest number of college-educated adults, Whitmer commands a 78% approval rating compared to Trump’s 14%, a 64 point disparity. Likewise, in Oakland and Leelanau counties, Whitmer leads Trump in approval by 32 points and 28 points, respectively.
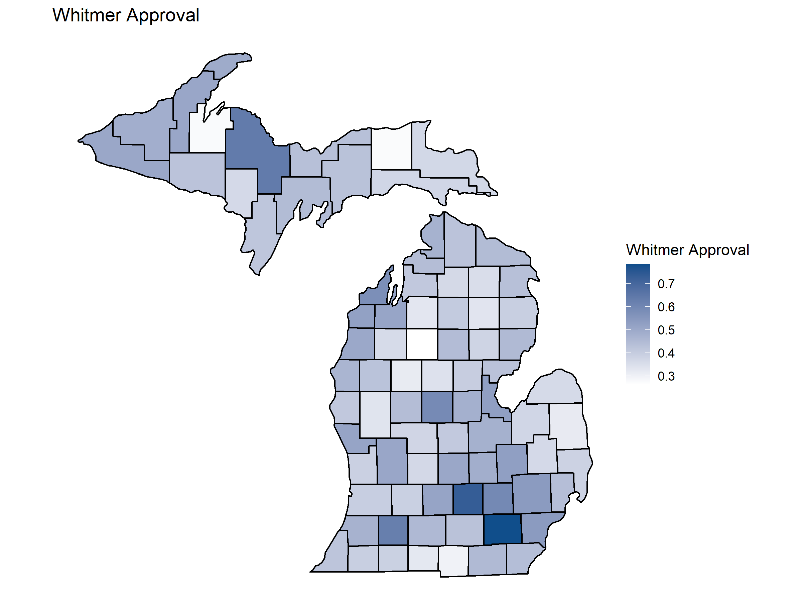 Whitmer also performed well in the state’s most populous and racially diverse counties. The governor reached 54% approval in Wayne County and 44% in Macomb. Trump, however, averaged 5% approval in Wayne and 26% in Macomb.
On the flip side, Trump polled best in predominately white, lower-income, and sparsely populated counties. He maintained approval ratings in the mid-to-high thirties in counties like Roscommon, Crawford, Montmorency, and Menominee.
By and large, the new county estimates fare well for Whitmer, poorly for Trump, and shed light on the partisanship of Michigan’s electorate.
 Whitmer’s county-level approval ratings widely outshine Trump’s. In all but five of Michigan’s 83 counties, the governor maintains a higher approval than the former president, as of the fall of 2020. This county-level Democratic advantage continued into the 2020 presidential election.
Trump, in his reelection bid, lost the state to President Joseph R. Biden who dominated urban hubs and populated areas. Yet, despite Trump’s dismal approval ratings in Michigan during that time, he nonetheless won 72 counties and 48% of the state’s popular vote in the November 2020 election.
Michigan’s Upper Peninsula serves as a microcosm of this disparity between Trump’s approval and his electoral gains. In this round of the State of the Survey, the UP generally rated Whitmer highly and Trump poorly. However, all but one of its counties voted for Trump in November. In Alger County, for example, Whitmer enjoys a 43% approval to Trump’s 23%; regardless, Trump beat Biden in Alger county by an almost equal margin: 59% to 40%. Similarly, 51% of Gogebic County approves of Whitmer, while only 27% approve of Trump; still, Trump beat Biden in Gogebic by 13 points.
This pattern repeats itself across the UP and outside of it as well. In Bay County, Whitmer commands an impressive 53% approval rating, while Trump averages a lackluster 29%. In spite of this, Donald Trump won Bay County’s popular support over Biden by 17 points.
What accounts for these differences? Why did so many Michiganders seem to disapprove of President Trump’s performance in the fall but vote for him all the same in November 2020? One possible explanation is that voters are less partisan when it comes to state politics than national politics. We live in a time when national politics is contentious, bitter, and above all hyper-partisan. So, even if some voters approve of a Democratic governor and feel comfortable voting one into office, they may not feel the same about a Democratic president. And even if they do not support the Republican presidential nominee, they still prefer him to the Democratic alternative and refuse to turn against their partisan allegiance in a national race. This phenomenon is not unique to Michigan. In political science, this voting pattern is known as negative partisanship, the idea that individuals vote on the basis of party, regardless of the candidate. In short, even if Republicans disapprove of Trump, they are unlikely to vote for a Democratic presidential candidate.
But at the end of the day, counties don’t vote for president, people do. And in Michigan in November 2020, more people voted for Joe Biden.
Regardless of why a number of voters disapproved of Trump but voted for him this past November, we can continue to explore this question and many more using IPPSR’s downloadable State of the State Survey data. With this data, constituents and lawmakers alike will be able to better understand the views of Michigan’s public.
We are also making the county-level estimates of public opinion available for download. In addition to estimates of presidential and gubernatorial approval, the dataset also includes data from the fall 2020 survey on trust in federal and state government, optimism about the state’s economic future, and willingness to receive the Covid-19 vaccines. Data and documentation is available for download.
Michael Breslin is an undergraduate policy fellow at IPPSR. He is a junior at MSU studying political science, international development, and history. His primary research interest is economic policy. He previously worked as a communications intern for Mayor Lori Lightfoot of Chicago. IPPSR Research Associate Joshua McCrain, Ph.D., provided assistance with research and analysis.


